Optimal keyboard layouts
I algorithmically design keyboard layouts optimized for different languages, based on crowdsourced typing preference data (engram-layouts.xyz).
I algorithmically design keyboard layouts optimized for different languages, based on crowdsourced typing preference data (engram-layouts.xyz).
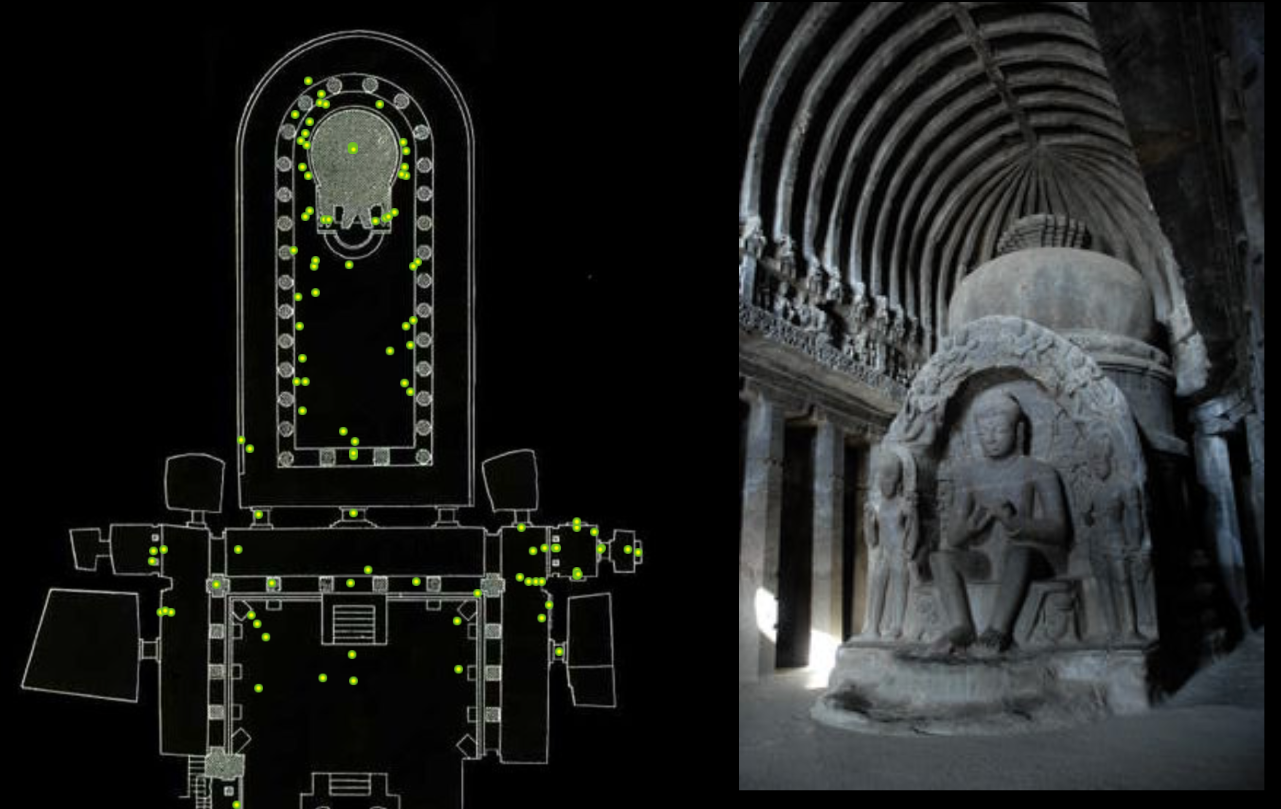
My wife and I created the first comprehensive photodocumentation of the Buddhist, Hindu, and Jain cave temples of Ellora in India, with a database of over 8,000 photographs referenced against ground plans (elloracaves.org). This work was partly funded by grants from the Mellon Foundation and the Indian government. Mapin published our book "Ellora: Cross-Fertilization of Style in Buddhist, Hindu and Jain Cave Temples" in 2026.
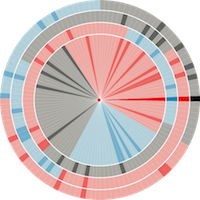
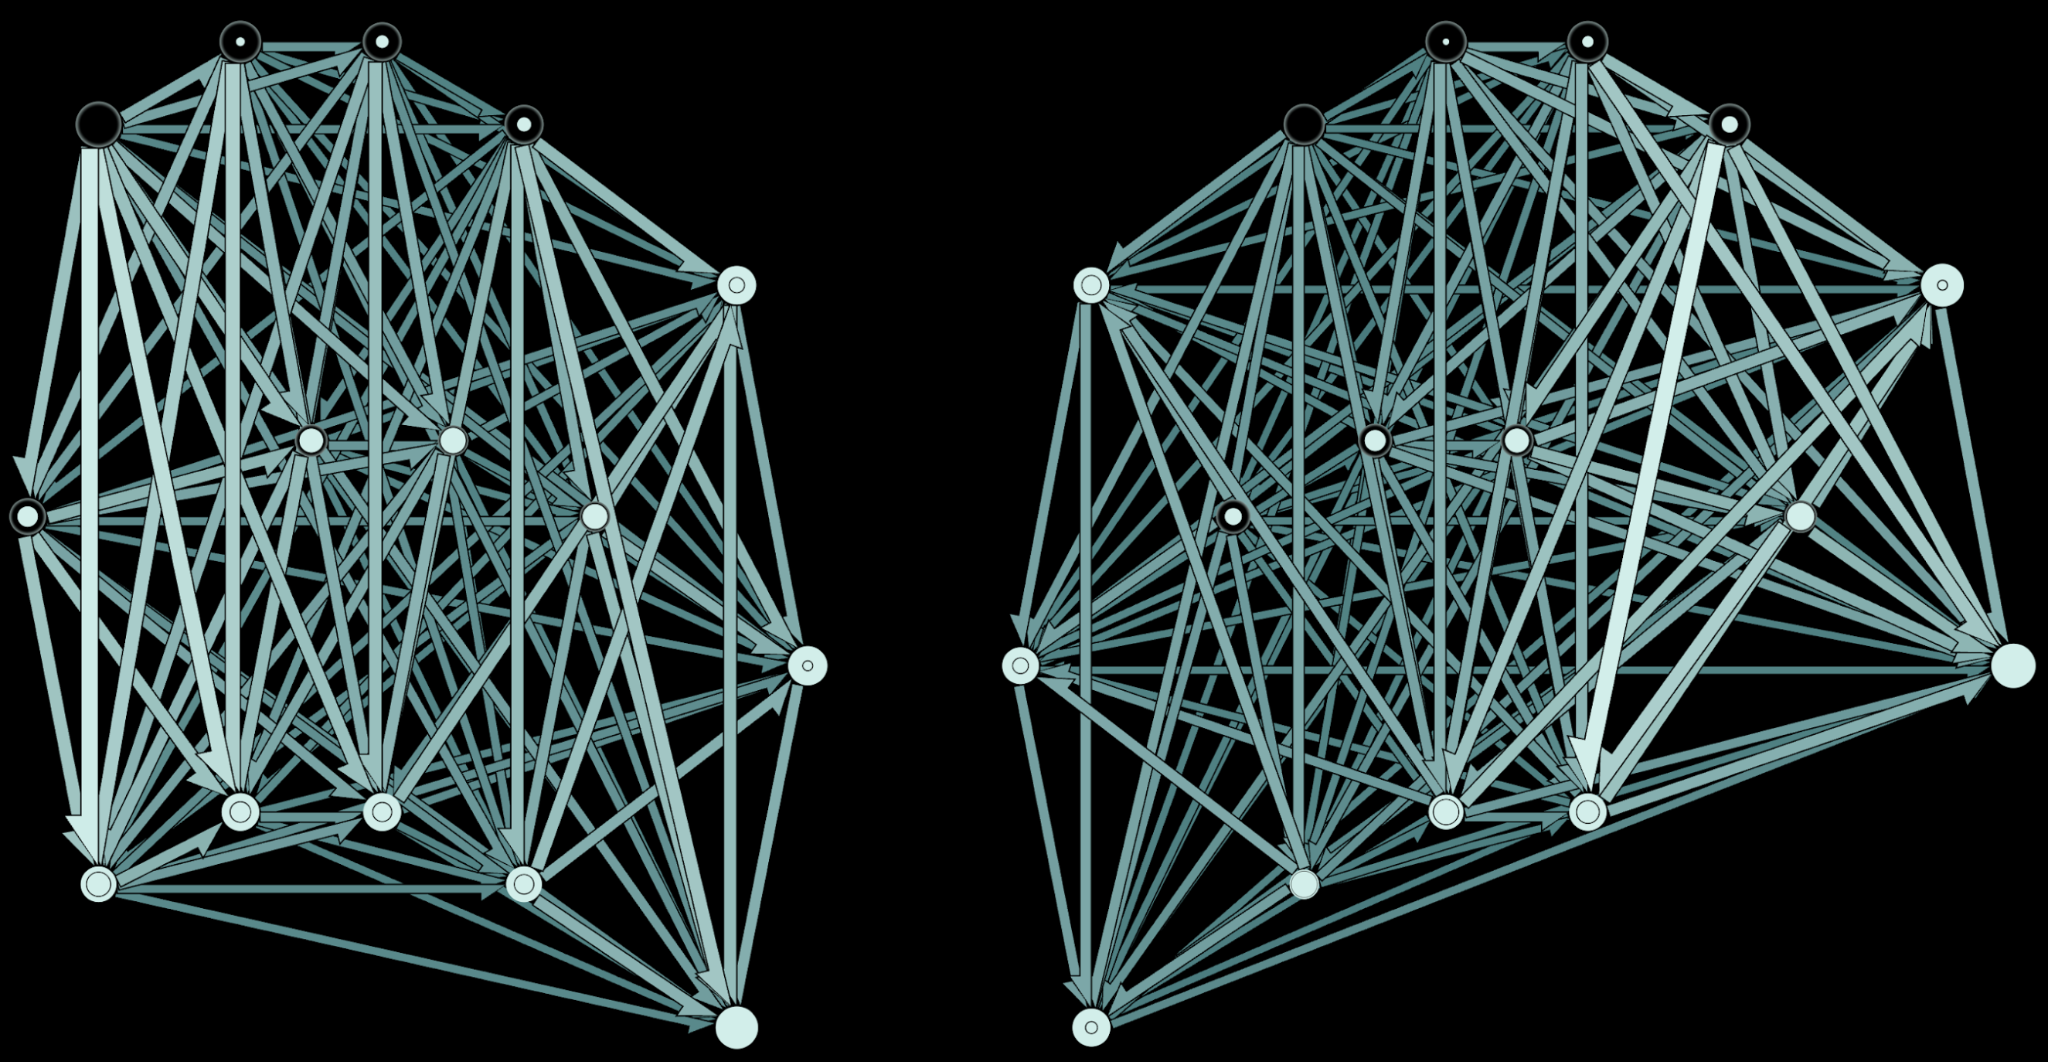
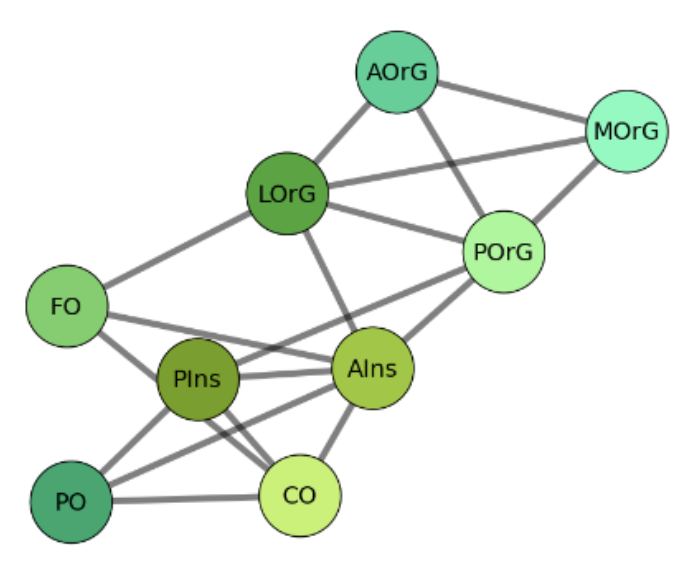
I built the database and website infovis back in 2008 as part of work on graphical taxonomies. You can still search for information graphics from a curated set of over 1,000 examples, including networks, cyberspaces, data visualizations, cartograms, etc.
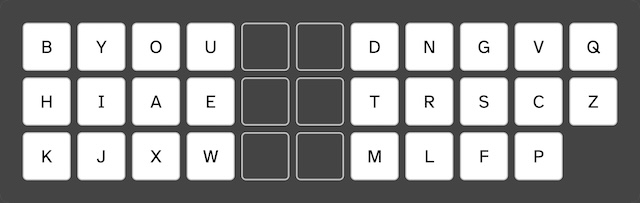
A Klein. Optimizing comfortable keyboard layouts using human typing preferences and language-dependent n-grams: the Engram Study. International Journal of Human-Computer Interaction, 1–30. (2026). doi:10.1080/10447318.2026.2665409
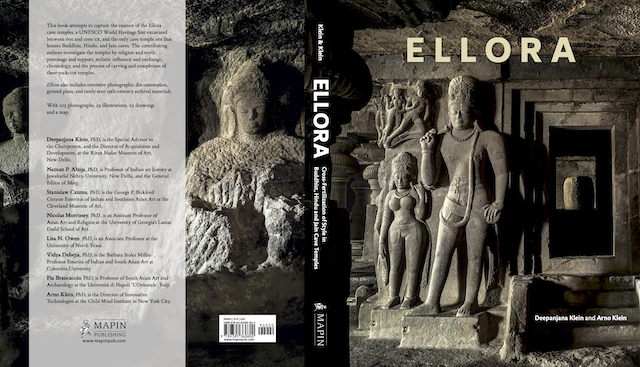
D Klein, A Klein (Eds.). Ellora: Cross-Fertilization of Style in Buddhist, Hindu and Jain Cave Temples. Ahmedabad, India: Mapin Publishing Pvt. Ltd. (2026).
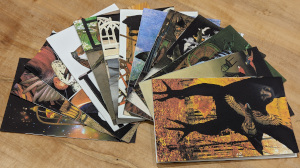
A Klein, KA Klein. Birds on Chairs (12 illustrated short stories). Chicken in a Snowstorm Press (2020).
A Klein. The Insect's Final Dream. Chicken in a Snowstorm Press (2017). 2018 Exhibits: Kohler Art Library, Madison, WI; Athens Art Exhibition, Athens, GA.
A Klein, KA Klein. Hugo Bristol and the Night Sky. Chicken in a Snowstorm Press (2013).
A Klein. CTHRU: A composition-based taxonomy of information graphics. Medium (2016).
A Klein, W Bevington. "Information visualization" entry in: Erlhoff Michael, Marshall Tim, eds. Design Dictionary: Perspectives on Design Terminology. Basel, Boston, Berlin: Birkhauser Verlag (2008).
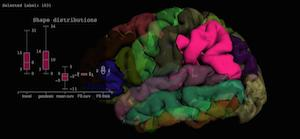
A Keshavan, A Klein, B Cipollini. Interactive online brain shape visualization (2015 Brainhack event) Research Ideas and Outcomes 3: e12358 (2017). doi:10.3897/rio.3.e12358
A Klein, A Worth, J Tourville, B Landman, T Dal Canton, SS Ghosh, D Shattuck. An interactive tool for constructing optimal brain colormaps. 40th Annual Meeting for the Society for Neuroscience (2010).
A Klein. Data-visual relationships to subject performance and eye movements (2007 NSF proposal). Research Ideas and Outcomes. 2: e8814 (2016). doi:10.3897/rio.2.e8814
Since the time I built a basement optics lab with a friend in high school to create holograms, I have been making display holograms and conducting research on 3-dimensional display technologies, at the University of Southern California, the University of Michigan, and at the MIT Media Laboratory. For my thesis work at MIT, I created the deepest dispersion-controlled viewing stations, and the thinnest edge-lit holograms, both of which use a hologram to present specially controlled light sources (pre-distorted wavefronts or pre-dispersed light) to a second, display hologram for sharper and deeper images. Since then, I have formulated a general raytracing equation for holograms. Holography has influenced my later research in surprising ways.
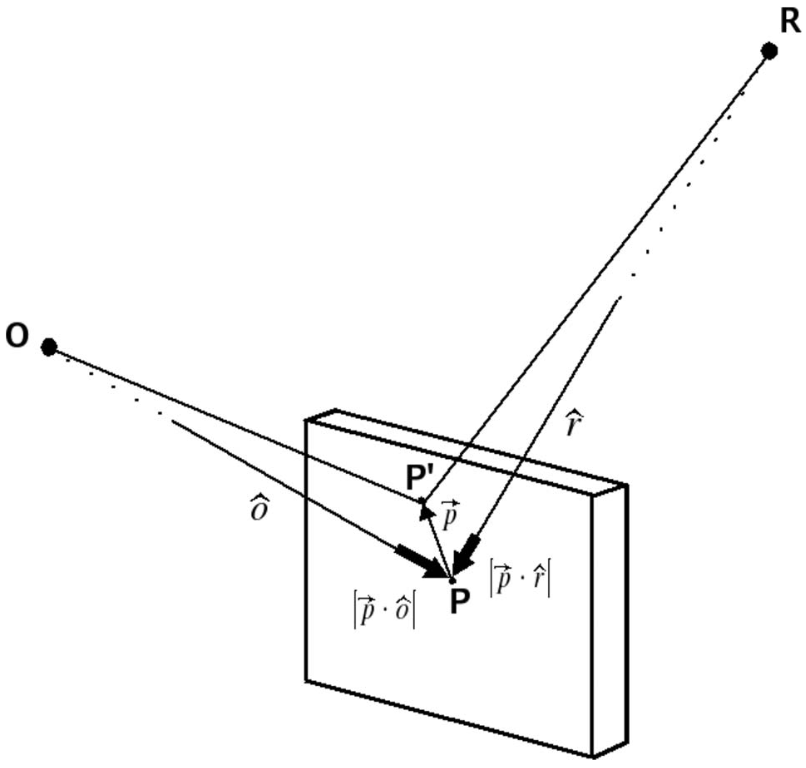
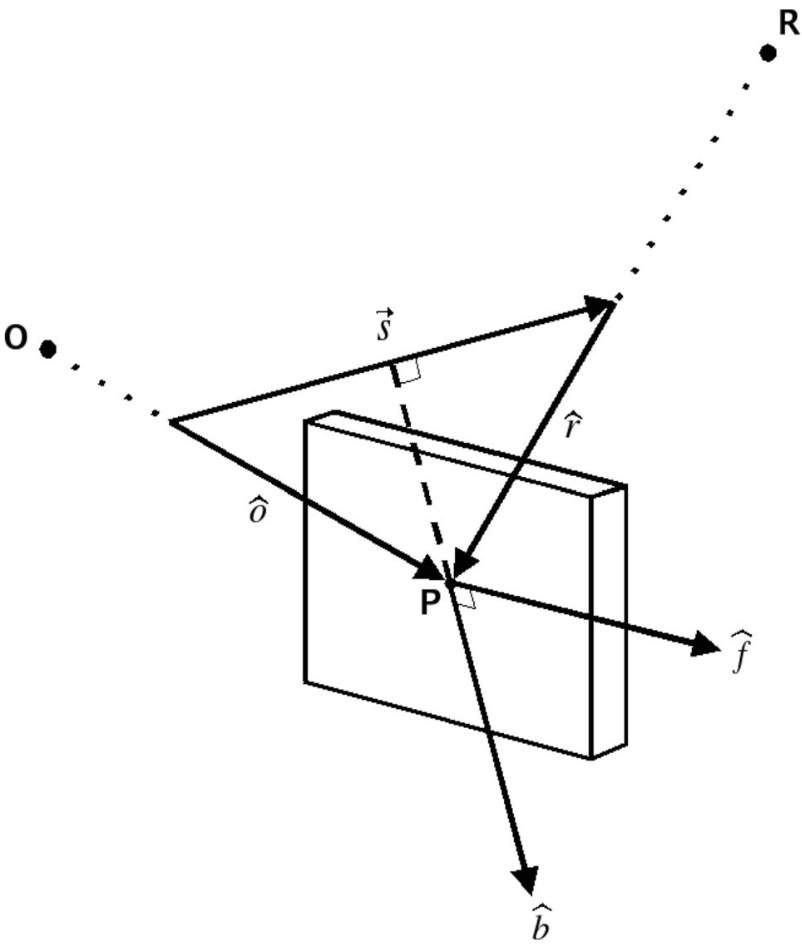
A Klein. Relating vector ray-tracing equations for holograms of arbitrary shape and thickness. Journal of the Optical Society of America A. 25(4): 979-983 (2008).
MA Klug, A Klein, W Plesniak, A Kropp, B Chen. Optics for full-parallax holographic stereograms. Proc. SPIE. 3011 (78) "Practical Holography XI" (1997). doi:10.1117/12.271340